

Many of us are finding money a struggle as the cost-of-living crisis mounts, but people in some pockets of North Kirklees could be feeling the pinch far more.
We’ve compiled a list of the neighbourhoods in North Kirklees with the lowest estimated average annual household income, based on the latest figures published by the Office for National Statistics. These are the areas which could be far less able to afford the rocketing cost of food and bills.
The ONS breaks Kirklees down into 59 neighbourhoods called Middle-layer Super Output Areas (MSOA).
The highest average income, according to the statistics, is £44,600, while the lowest is £29,300.
The average income statistics are the latest available by neighbourhood, published by the Office for National Statistics in March 2020 and relating to the financial year ending 2018.
Total annual household income is the sum of the before-tax income of every member of the household, plus any income from benefits. The estimates were calculated by the ONS using various sources of information, including the 2011 Census and the annual Family Resources Survey.
Here are the 10 poorest neighbourhoods in North Kirklees based on average income.
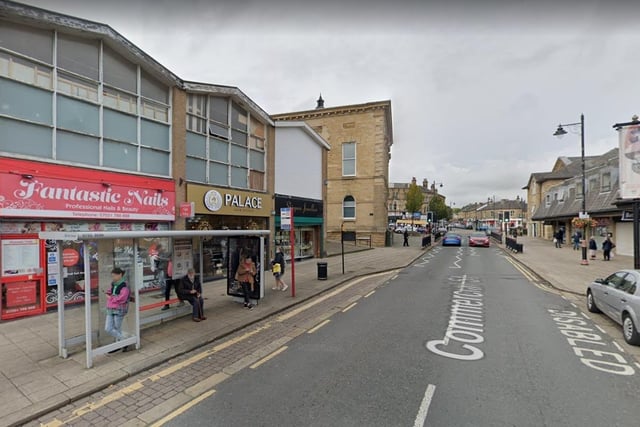
1. Batley Central
The estimated average annual household income for Batley Central is £29,300. Photo: Google
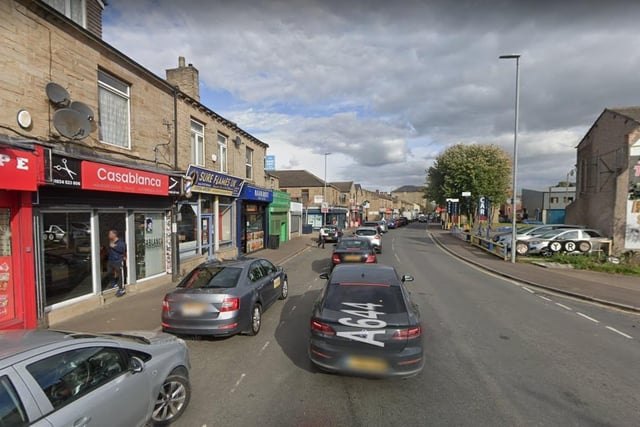
2. Ravensthorpe
The estimated average annual household income for Ravensthorpe is £30,700. Photo: Google
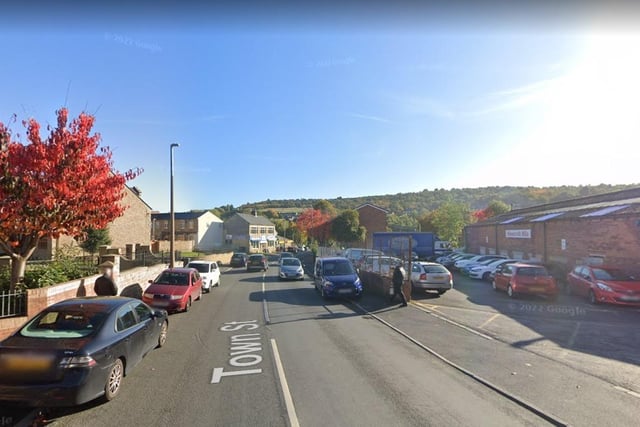
3. Batley Carr and Mount Pleasant
The estimated average annual household income for Batley Carr and Mount Pleasant is £32,200. Photo: Google
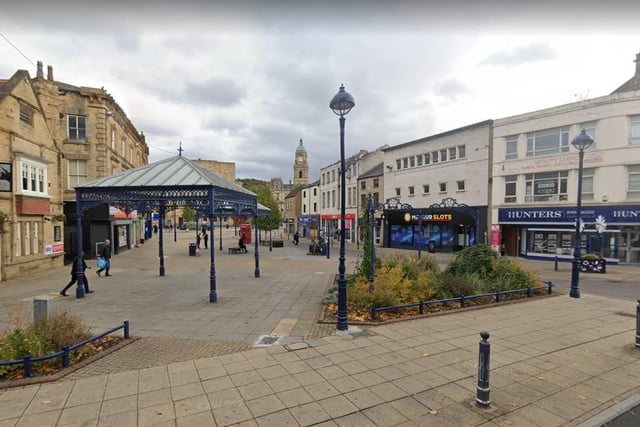
4. Dewsbury Central and Westborough
The estimated average annual household income for Dewsbury Central and Westborough is £33,000. Photo: Google