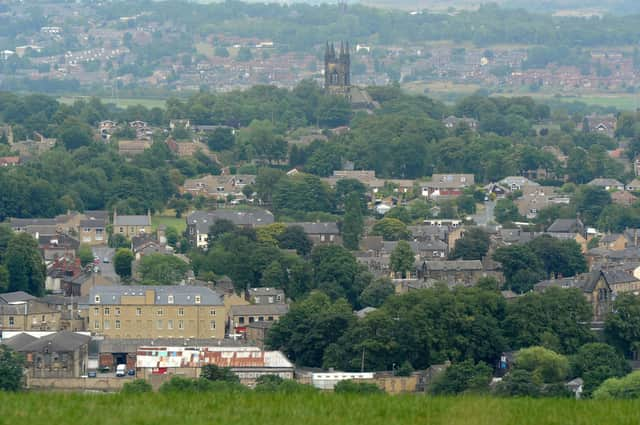
House prices vary dramatically across different parts of the district, the figures from the Office for National Statistics (ONS) show.
These figures are based on new ONS analysis of HM Land Registry data on prices paid for properties in the year to September 2022.
The ONS splits England and Wales into 7,202 small areas, of which 66 have average house prices of at least £1 million. Of these millionaire communities, 89 per cent can be found in the capital.
However, property prices are continuing to rise nationally. Monthly figures published as part of HM Land Registry’s House Price Index show how the market has changed over the last year.
Figures for September 2022 show the average property price in England was £307,710, more than £25,000 more expensive than a year before.
So, how do property prices compare across North Kirklees? Here we reveal the 11 most expensive neighbourhoods to buy a property.
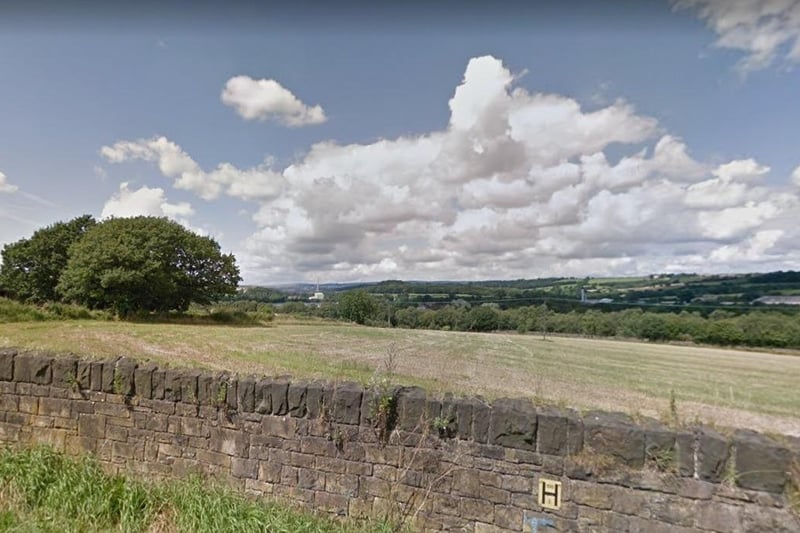
1. Battyeford village
The median price paid for a property in Battyeford village is £225,000. Photo: Google streetview
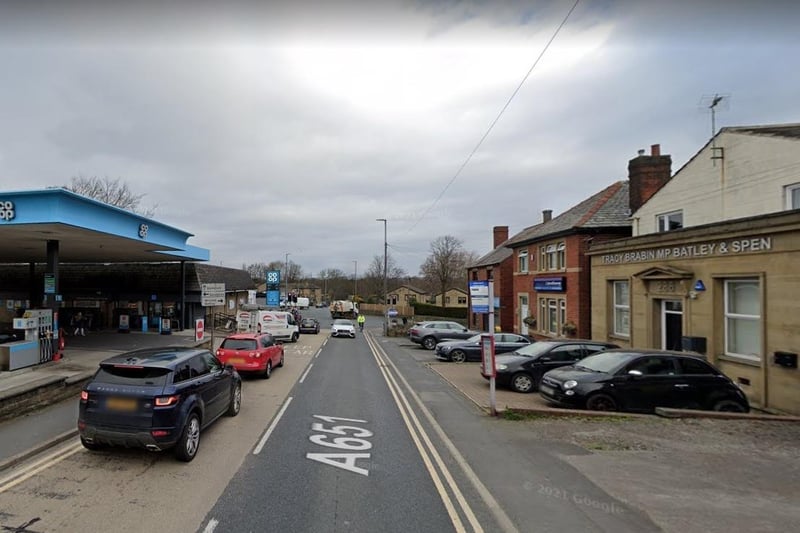
2. Gomersal
The median price paid for a property in Gomersal is £219,250 Photo: Google streetview
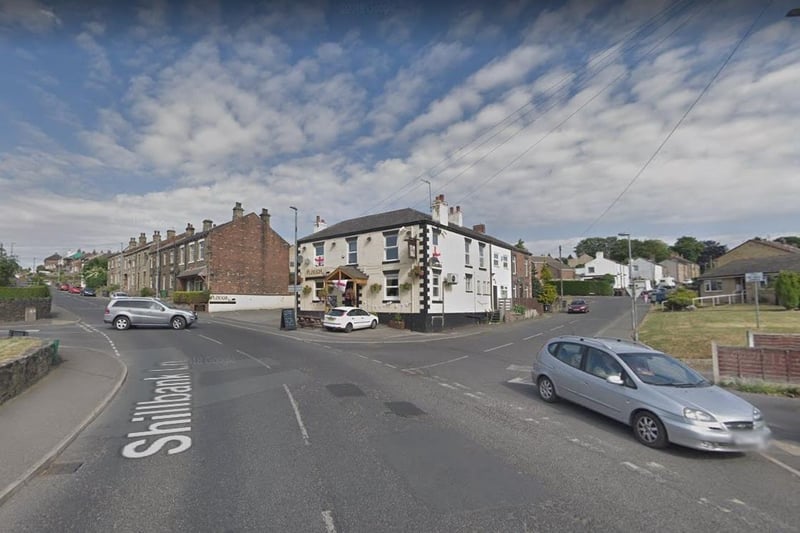
3. Northorpe and Crossley
The median price paid for a property in Northorpe and Crossley is £208,500 Photo: Google streetview
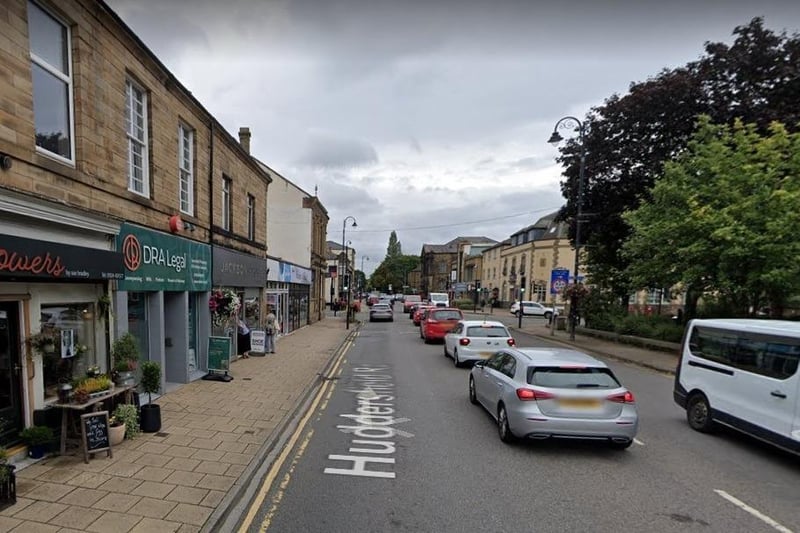
4. Mirfield Central and Hopton
The median price paid for a property in Mirfield Central and Hopton is £195,000 Photo: Google streetview
