UK’s speed camera hotspots revealed: the regions with the most cameras and worst offenders named


New police data has revealed the UK regions with the most speed cameras and the worst offences recorded - including one motorist clocked at 191mph.
Figures from forces around the country reveal how some rely on hundreds of fixed cameras to enforce speed limits while others use just a handful to catch out lawbreakers.
Advertisement
Hide AdAdvertisement
Hide AdThey also reveal that in recent years several drivers have been clocked at more than twice the motorway speed limit.
Speed cameras have been a controversial tool since the first appeared on UK roads 30 years ago. Opponents claim they are used to generate revenue rather than to improve road safety but every year they catch millions of drivers breaking the speed limit, landing them with fines of at least £100 and a minimum of three penalty points.


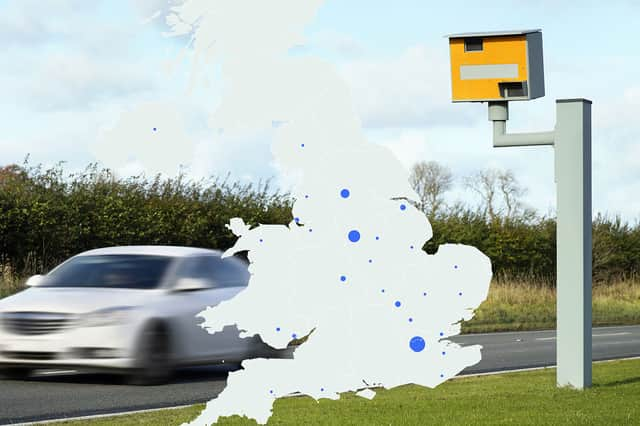
According to the figures, released by 25 of the UK’s 43 forces, London has more speed enforcement cameras than any other region, with 995 fixed cameras currently installed in the 609 square mile area covered by the Metropolitan Police.
Not only does that mean it has more cameras than any other area but also more cameras per square mile than any other force, with 16 cameras for every 10 square miles.
Advertisement
Hide AdAdvertisement
Hide AdDerbyshire has the second most cameras and also the second highest density, with its 958 cameras equating to 9.4 cameras per 10 square miles - almost twice as many as West Yorkshire, which has 5.1 fixed cameras for every 10 square miles.
The figures, obtained via a freedom of information request by short-term insurer Go Shorty, showed that some areas had far fewer fixed camera locations, with two forces - the Police Service of Northern Ireland and Suffolk Constabulary employing just five cameras each.
PSNI, which is responsible for policing more than 5,000 square miles of territory, has just 0.009 fixed cameras per 10 square miles. Suffolk’s far smaller area means it has a higher density (0.03 per 10 square miles), slightly higher than Northamptonshire, which is tied with Northern Ireland.
Loading....
As well as tracking how many fixed cameras each force has in operation the FOI request obtained information on the worst speeding offences recorded from 2018-2020. Not all forces revealed statistics but of those that did Nottinghamshire reported by far the worst offender - a motorist caught travelling at 191mph.
Advertisement
Hide AdAdvertisement
Hide AdSome distance behind that but still almost 100mph over the limit, was a driver clocked at 163mph on the M62 in Humberside. The third highest speed was also recorded on the M62, this time in West Yorkshire, where police detected a driver doing 159mph.
Only two forces reported a worst offender who was caught doing less than 100mph - Cheshire (94mph) and Dorset (99mph).
Separate FOI information gathered by Rivervale Leasing also revealed the different thresholds applied by speed cameras across many police forces. Of the 21 forces which responded to the inquiry, 10 confirmed they applied the much-discussed 10% +2mph rule, meaning a driver would need to be doing 35mph in a 30 zone or 79mph in a 70 zone to trigger a camera.
Several declined to confirm a threshold while Essex said it applied the 10% +2mph up to 9mph over the limit and Lancashire used a 10% +3mph rule up to 9mph over the limit.
